A well-designed Power BI dashboard enables businesses to visualize key insights, track performance, and make data-driven decisions. Whether you’re a beginner or looking to improve your dashboard skills, this guide will help you create an engaging Power BI dashboard for your business.
1. Define Your Dashboard Goals
Before building a dashboard, identify the purpose and key metrics you want to track. Whether it’s sales performance, marketing analytics, or financial reporting, having clear objectives ensures that your dashboard delivers meaningful insights.
2. Connect and Prepare Your Data
Power BI allows you to connect to various data sources such as Excel, SQL Server, SharePoint, and cloud services. Use Power Query to clean and transform your data, ensuring accuracy and consistency before visualization.
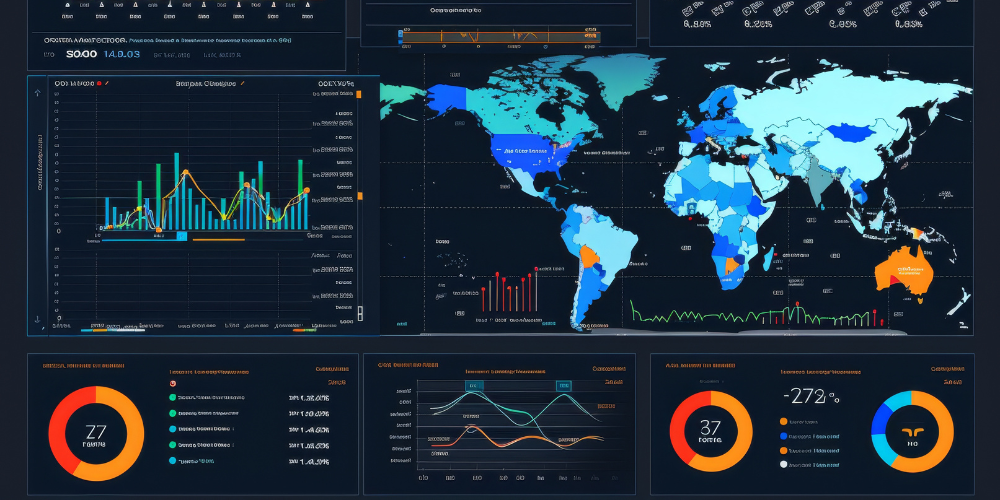
3. Choose the Right Visuals
Selecting the right visuals enhances data comprehension. Power BI offers a variety of visualization options:
- Bar and column charts for comparisons
- Line charts for trend analysis
- Pie charts and doughnuts for proportions
- KPIs and scorecards for key metrics
Keep your visuals simple and meaningful to avoid clutter and confusion.
4. Design for User Engagement
A well-structured dashboard should be clear, interactive, and user-friendly. Arrange visuals logically, use consistent colors and fonts, and include slicers or filters to enable users to interact with the data dynamically.
5. Implement Interactivity and Filters
Enhance user experience by adding interactive elements such as:
- Slicers to filter data dynamically
- Drill-through pages for in-depth analysis
- Bookmarks to create customized views
These features help users explore data efficiently without overwhelming them with too much information at once.
6. Publish and Share Your Dashboard
Once your dashboard is complete, publish it to the Power BI Service for secure access and collaboration. Set up scheduled data refreshes to ensure your reports stay up to date, and configure role-based access permissions to control data security.
Conclusion: Build Impactful Dashboards with Power BI
Creating an engaging Power BI dashboard requires a balance between effective data visualization, interactivity, and clarity. By following these steps, you can design dashboards that provide actionable insights for better decision-making. Start mastering Power BI today and transform your business with data-driven intelligence!
This Article is Uploaded by: Gokul K
Keywords: Power BI dashboard creation, Power BI dashboard best practices, Power BI dashboard tutorial, Power BI interactive dashboards, Power BI dashboard design, Power BI business dashboard, Power BI dashboard step by step, Power BI executive dashboard, Power BI KPI dashboard, Power BI dashboard for data visualization, Power BI dynamic dashboard, Power BI dashboard examples, Power BI dashboard layout, Power BI dashboard for beginners, Power BI real-time dashboard, Power BI self-service dashboard, Power BI dashboard components, Power BI dashboard storytelling, Power BI dashboard design tips, Power BI dashboard visuals, Power BI dashboard interactivity, Power BI dashboard templates, Power BI dashboard vs reports, Power BI dashboard with slicers, Power BI dashboard performance optimization, Power BI dashboard filters, Power BI advanced dashboard techniques, Power BI dashboard automation, Power BI dashboard for sales, Power BI dashboard for marketing, Power BI dashboard for finance, Power BI dashboard for HR, Power BI dashboard for operations, Power BI dashboard for supply chain, Power BI dashboard for small business, Power BI dashboard for startups, Power BI dashboard for e-commerce, Power BI dashboard for healthcare, Power BI dashboard for customer analytics, Power BI dashboard for social media, Power BI dashboard for project management, Power BI dashboard for executive reporting, Power BI dashboard for tracking metrics, Power BI dashboard with AI insights, Power BI dashboard with predictive analytics, Power BI dashboard performance tuning, Power BI dashboard refresh settings, Power BI dashboard embedded solutions, Power BI dashboard export options, Power BI dashboard for presentations, Power BI dashboard for Google Analytics, Power BI dashboard vs Tableau dashboard, Power BI dashboard customization, Power BI dashboard integration with Excel, Power BI dashboard integration with SQL, Power BI dashboard and Power Query, Power BI dashboard and DAX, Power BI dashboard and Power Automate, Power BI dashboard mobile version, Power BI dashboard dark mode, Power BI dashboard security settings, Power BI dashboard data sources, Power BI dashboard publishing, Power BI dashboard sharing, Power BI dashboard cloud vs on-premise, Power BI dashboard best color schemes, Power BI dashboard for real-time monitoring, Power BI dashboard for industry trends, Power BI dashboard for tracking OKRs, Power BI dashboard for data-driven decisions, Power BI dashboard for forecasting, Power BI dashboard for business intelligence, Power BI dashboard for competitive analysis, Power BI dashboard user experience, Power BI dashboard UI/UX tips, Power BI dashboard row-level security, Power BI dashboard with multiple pages, Power BI dashboard navigation, Power BI dashboard vs paginated reports, Power BI dashboard publishing on Power BI Service, Power BI dashboard for Power BI Pro users, Power BI dashboard premium features, Power BI dashboard for large datasets, Power BI dashboard with real-time streaming, Power BI dashboard for IoT analytics, Power BI dashboard with drill-through, Power BI dashboard bookmarking, Power BI dashboard and role-based security, Power BI dashboard case studies, Power BI dashboard performance monitoring, Power BI dashboard for finance professionals, Power BI dashboard for government agencies, Power BI dashboard for freelancers, Power BI dashboard for consultants, Power BI dashboard for enterprise reporting, Power BI dashboard for career growth, Power BI dashboard training course, Power BI dashboard certification, Power BI dashboard Udemy courses, Power BI dashboard LinkedIn Learning, Power BI dashboard Coursera certification, Power BI dashboard business intelligence skills, Power BI dashboard professional development.
Leave Your Comment Here