


Purpose
Sequence diagram are used to model the logic of usage scenarios by showing the information passed between objects in the system through the execution of the scenario.
Business Analysis Body of Knowledge® (BABOK®)
The sequence diagram shows how the process are connected during the scenario. They are also used to show how the software components interact with the system. It is used to analyze, plan, and execute the software based systems. The sequence diagram, as the name suggests its a chart that describes the interaction of participants in a system, as well as the order of those interactions. Business analysts can derive plenty of information from this type of chart because sequence diagram clearly lay out the timeline of complex processes. Sequence diagram is also called as a interaction diagram which is used to show the interactive behavior of the system. It simply depicts the interaction between objects in a sequential order that is the order in which these interactions takes place. These diagrams are widely used by the businessmen and software developers to document and understand the requirements for new and existing systems.
The sequence diagram shows how the processes or the objects interact during the scenario. The classes required to execute the scenario and the messages they pass to one another are displayed on the diagram. They are also often used to show how user interface components or the software components interact. The diagram represents information in a vertical and horizontal alignment. The object that send message to each other are represented a boxes that are aligned at the top of the page from left to right, with each object occupying a column a space on the page boarded by a vertical line stretching down to the bottom of the page. The messages that are sent from one object to the other are represented as horizontal arrows. Sequence diagrams are also called as the event diagrams.
Some of the articles related to Sequence diagram techniques are as follows,
- Sequence Diagram - https://courses.cs.washington.edu/courses/cse403/15sp/lectures/L10.pdf
- UML Sequence Diagrams - https://www.geeksforgeeks.org/unified-modeling-language-uml-sequence-diagrams/
- Sequence Diagram: A Complete Guide - https://creately.com/blog/diagrams/sequence-diagram-tutorial/
- Sequence as Interaction Diagram - https://www.tutorialspoint.com/uml/uml_interaction_diagram.htm
- System Sequence Diagram - https://stg-tud.github.io/eise/WS11-EiSE-11-System_Sequence_Diagrams.pdf
- Sequence Diagram with Examples - https://www.guru99.com/interaction-collaboration-sequence-diagrams-examples.html
- Introduction to Sequence Diagram - http://www.nyu.edu/classes/jcf/g22.2480-001_sp09/handouts/UMLBasics.pdf
- Sequence Diagram Template - https://online.visual-paradigm.com/diagrams/templates/sequence-diagram/simple-atm/
- Sequence Diagram Technique - https://www.scribd.com/document/123982026/sequence-diagrams-pdf
- Overview of Sequence Diagram - https://www.sciencedirect.com/topics/computer-science/system-sequence-diagram
- Developing Sequence Diagram - https://www.researchgate.net/publication/2370102_Developing_Sequence_Diagrams_in_UML
The main elements of sequence diagram consists of,
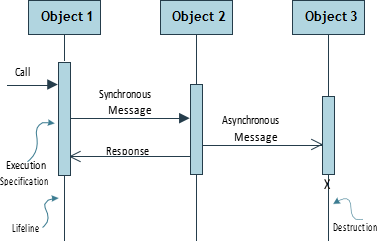
- Lifeline - It represents the life span of the object during the scenario being modeled in the sequence diagram. It is drawn as a dashed line that vertically descends from each object box to the bottom of the page.
- Activation Box - It represents the period during which an operation is executed. A call to activate is represented by the arrow with the solid arrow head leading to the activation object.
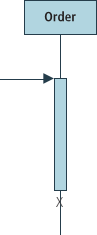
- Message - It is an interaction between two objects. It is shown as an arrow coming from the activation box of the object that sends the message to the activation box of the object that receives the message. There are two different types of message,
- Synchronous Call
- Asynchronous Call
Business Analysis Body of Knowledge® (BABOK®)
Some of the books for Sequence diagram techniques are,
- Sequence Diagrams | Bernard Tschumi | https://www.amazon.com/Diagrams-Sequences-Bernard-Tschumi/dp/1968967589/ref=sr_1_2?dchild=1&keywords=sequence+diagram+books&qid=1592683510&sr=8-2


